Monday, July 18, 2016

How Linux Kernel Manages Application Memory

Linux uses Virtual Memory (VM) that acts as a logical layer between application memory requests and physical memory (RAM). VM abstraction hides the complexity of platform specific physical memory implementation from the application. When application accesses virtual addresses exported by VM, hardware MMU raises an event to tell the kernel that an access has occurred to an area of memory that does not have physical memory mapped to it. This event results in an exception, called Page Fault, that is serviced by Linux kernel by mapping a faulted virtual address to physical memory page.
Virtual to Physical Page Translation

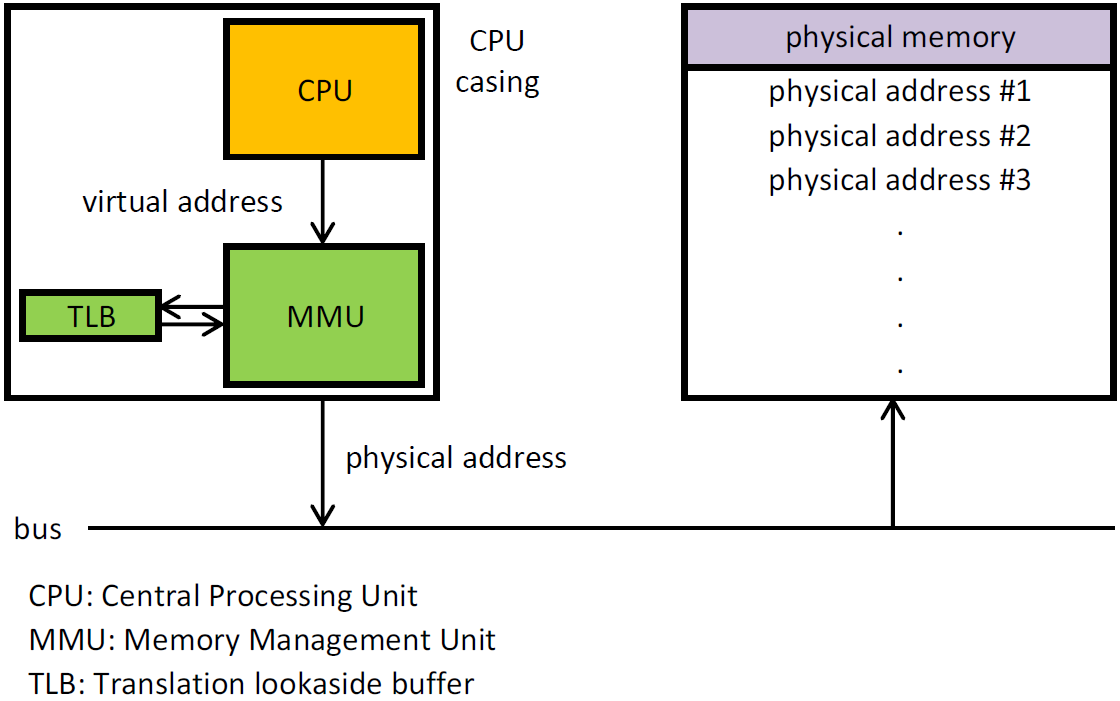
A page is simply a group of contiguous linear addresses in physical memory. Page size is 4 KB on x86 platform. Virtual addresses are transparently mapped to physical memory by collaboration of hardware ( MMU, Memory Management Unit) and software ( Page Tables). Virtual to physical mapping information is also cached in hardware, called TLB (Translation Lookaside Buffer), for later reference to allow quick lookup into physical memory locations.

Virtual to physical memory mapping
VM abstraction offers several benefits:
  • Programmers do not need to know physical memory architecture of the platform. VM hides it and allows writing architecture independent code. 
  • Process always see linear contiguous range of bytes in its address space, regardless of how fragmented the physical memory. 
    • For example: when application allocates 10 MB of memory, Linux kernel reserves 10 MB of contiguous virtual address range in the process address space. Physical memory locations where these virtual address range is mapped may not be contiguous. Only part that is guaranteed to be contiguous in the physical memory is the size of the page (4 KB).
  • Faster startup due to partial loading. Demand paging loads instructions as they are referenced.
  • Memory sharing. A single copy of library/program in physical memory can be mapped to multiple process address space. Allows efficient use of physical memory. "pmap -X <pid>" can be used to find what process resident memory is shared by other process or private.
  • Several programs with memory footprints bigger than physical memory can run concurrently. Kernel behind the scene relocates least recently accessed pages to disk (swap) transparently. 
  • Processes are isolated into its own virtual address spaces and thus cannot affect or corrupt other process memory.
Two processes may use same virtual addresses, but these virtual addresses are mapped to different physical memory locations. Processes that attach to same shared memory (SHM) segment will have their virtual addresses mapped to same physical memory location.
getfile
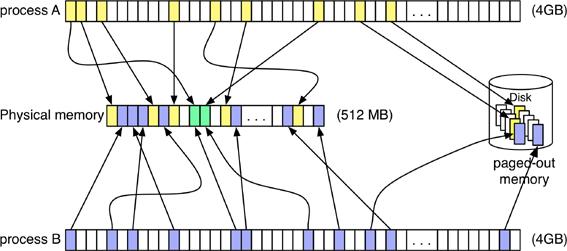
Process address space can span to 32-bit or 64-bit. 32-bit address space is limited to 4GB, as compared to hundreds of Terabytes for 64-bit address space. Size of process address space limits the amount of physical memory application can use.
Process virtual address space is composed of memory segments of type: Text, Data, Heap, Stack, Shared (SHM) memory and mmap. Process address space is defined as the range of virtual memory addresses that are exported to processes as its environment. Process address map can be viewed using "pmap -X <pid>". 
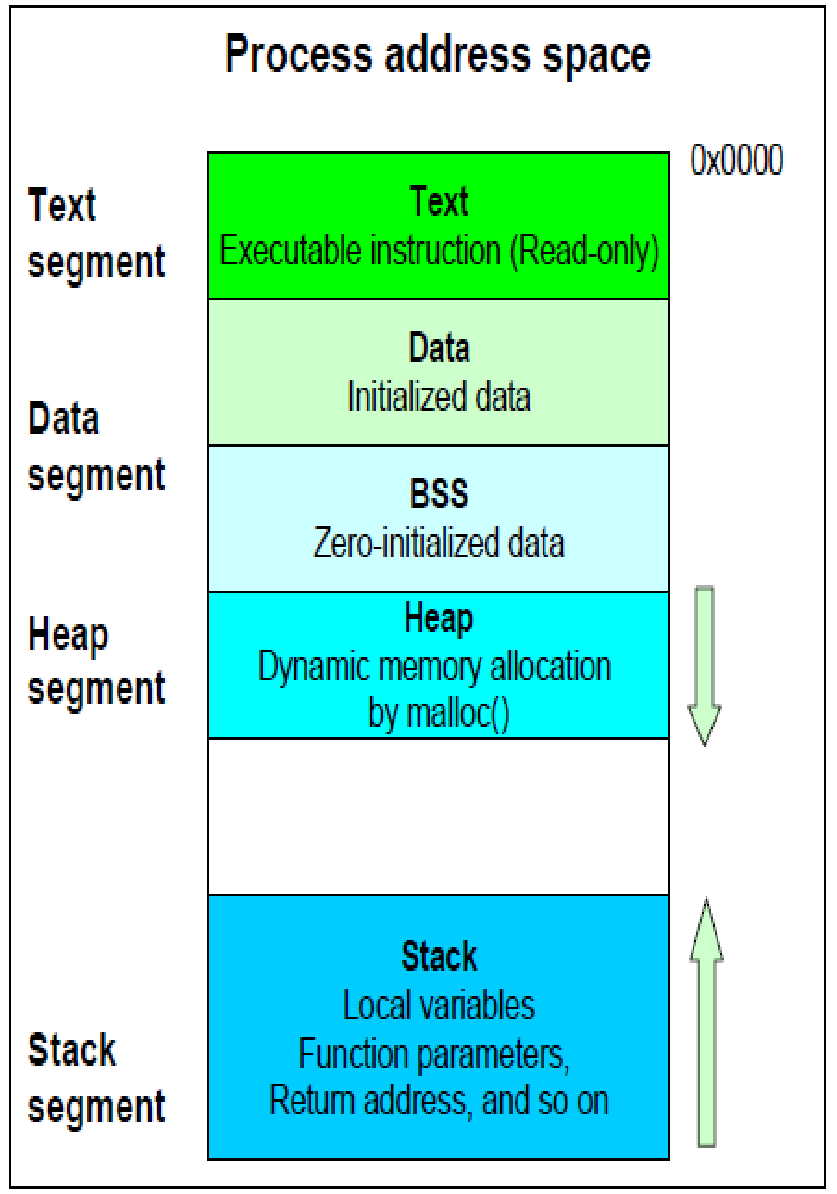
various memory segments that are part of process address space
Each memory segment is composed of linear virtual address range with starting and ending addresses, and are backed by some backing store like: filesystem or swap. Page fault is serviced by filling physical memory page from the backing store. Also, during memory shortages, data cached in physical memory pages is migrated to its backing store. Process "Text" memory segments is backed by executable file on the file system. Stack, heap, COW (Copy-on-Write) and shared memory pages are called anonymous (Anon) pages and are backed up by swap (disk partition or file). When swap is not configured, anonymous pages cannot be freed and are thus locked into memory considering no place to migrate data from these physical pages during memory shortages.
When process calls malloc() or sbrk(), kernel creates a new heap segment in the process address space and reserves the range of process virtual addresses that can be accessed legally. Any reference to a virtual address outside of reserved address range results in a segmentation violation, that kills the process. Physical memory allocation is delayed until process accesses the virtual addresses within the newly created memory segment. That means, application performing large 50GB of malloc and touching (page faulting) only 10 MB range of virtual addresses will consume only 10 MB of physical memory. One can view physical and virtual memory allocation per process using "ps", "pidstat" or "top" (Where: SIZE represents size of virtual memory segment and RSS represents allocated physical memory). Also, "pmap -X <pid>" can be used for detail view of type of process level memory allocation.
Physical memory pages used for program Text and caching file system data (called page cache) can be freed quickly during memory shortages considering data can always be retrieved from the backing store (file system). However, to free anonymous pages, data needs to be written to swap device before it can be freed.
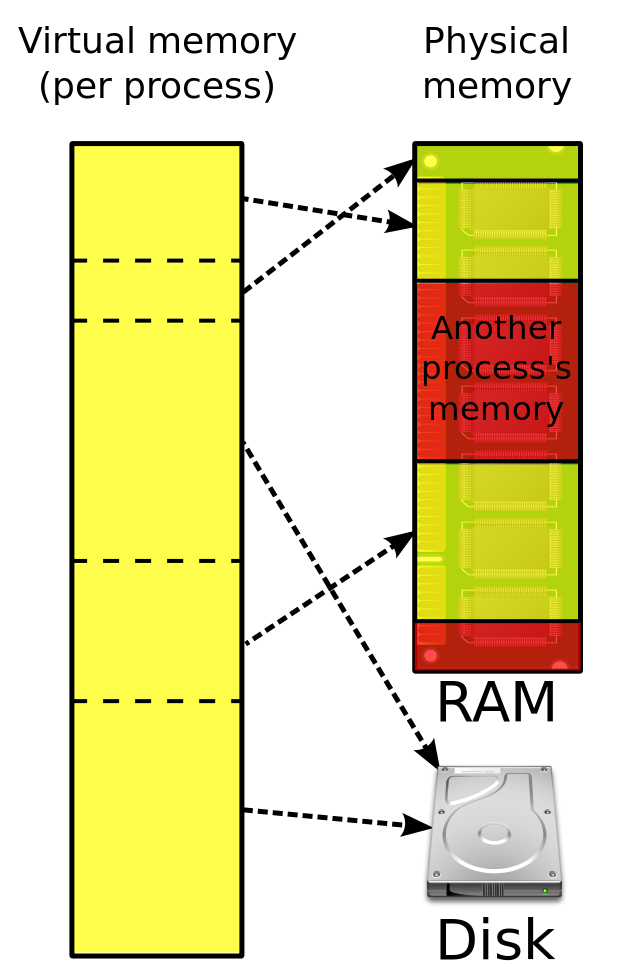
Anonymous memory segments (heap, stack, cow, shared memory) are backed by swap (Disk)

Linux Memory Allocation Policy

Process memory allocation is controlled by Linux memory allocation policy. Linux offers three different modes of memory allocations depending on the value set for tunable, vm.overcommit_memory
  • Heuristic overcommit (vm.overcommit_memory=0): Linux default mode allows processes to overcommit "reasonable" amount of memory as determined by internal heuristics, that takes into account: free memory and free swap. In addition to this, memory that can be freed by shrinking the file system cache and kernel slab caches (used by kernel drivers and subsystems) is also taken into consideration.
    • Pros: Uses relaxed accounting rules and it is useful for program that typically requests more memory than actually uses. As long as, there is a sufficient free memory and/or swap available to meet the request, process continue to function.
    • Cons: Linux kernel makes no attempt to reserve physical memory on behalf of process, unless process touches (access) all virtual addresses in the memory segment.   
      • Example, Let say application, myapp, allocates 50 GB of memory, but touches only 10 GB.  40 GB of physical memory not touched by myapp is available for other applications. If any other application(s) or malicious program touches all available free memory before "myapp" get to touch it, it could trigger OOM (Out Of Memory) Killer that may terminate "myapp" in a desperate attempt to find candidates that can be killed to free memory.
  • Always overcommit (vm.overcommit_memory=1): Allows process to overcommit as much memory as it wants and it always succeed. 
    • Pros: Wild allocations are permitted considering no restrictions on free memory or swap. 
    • Cons: Same as Heuristic overcommit. Application can malloc() TBs on a system with few GBs of physical memory. No failure until all pages are touched and that triggers OOM Killer.
  • Strict Overcommit (vm.overcommit_memory=2): Prevents overcommit by reserving both virtual memory range and physical memory. No overcommit means no OOM Killer. Kernel keeps track of amount of physical memory reserved or already committed. "cat /proc/meminfo" reports metrics such as: CommitLimit, Committed_AS to help estimate memory available for allocation. Since strict overcommit mode does not take free memory and swap into consideration, one should not use free memory or swap metrics (reported by free, vmstat ) to discover memory available. To calculate current overcommit or allocation limit, one should use the equation: "CommitLimit - Committed_AS". Kernel tunable "vm.overcommit_ratio" sets overcommit limit for this mode. Overcommit limit is set to: Physical Memory x overcommit_ratio + swap. Overcommit limit can be raised by setting vm.overcommit_ratio tunable to a bigger value (default 50% of physical memory). 
    • Pros: Disables OOM Killer. Failure at the startup has lower production impact than being killed by OOM Killer while serving production load. Solaris OS offers only this mode. Strict overcommit does not use free memory/swap for overcommit limit calculations.
    • Cons: No overcommit allowed. Memory allocated but not used by application may not be used by other application. A new program may fail to allocate memory even when the system is reporting plenty of free memory. This is due to reservation against the physical memory on behalf of existing processes. Monitoring for free memory becomes tricky. Some badly written applications do not handle memory allocation failures. Inability to check memory failures may results in corrupted memory and random hard to debug failures. 
      • Note: Memory not used by the application can still be used for filesystem cache considering page cache memory can be freed when application needs it.
NOTE: For both heuristic and strict overcommit, the kernel reserves a certain amount of memory for root. In heuristic mode, 1/32nd of the free physical memory. In Strict overcommit mode it is 1/32nd of the percent of real memory that you set. This is hard coded in kernel and cannot be tuned. That means a system with 64GB will reserve 2GB for root user.

What causes OOM Killer


When system level memory shortages reaches to an extreme situation where filesystem cache has been shrunk, all possible memory pages has been reclaimed, but memory demand continue to stay high that ultimately exhausts all the available memory. To deal with such situation, kernel selects processes that can be killed to free memory. This desperate kernel action is called OOM Killer.
Criteria used to find the candidate process some time kills the most critical process. There are few options available to deal with OOM Killer:
  • Disable OOM Killer by changing kernel memory allocation policy to strict overcommit.
    • $sudo sysctl vm.overcommit_memory=2
    • $sudo sysctl vm.overcommit_ratio=80
  • Opt out the critical process from OOM Killer consideration.
    • $ echo -17 > /proc/<pid-critical-process>/oom_adj
  • Opting out critical server process may sometime not be enough to keep system functioning. Kernel still has to kill processes in order to free memory. In some cases, automated reboot server to deal with OOM Killer may the better option.
    • $sudo sysctl vm.panic_on_oom=1
    • $sudo sysctl kernel.panic="number_of_seconds_to_wait_before_reboot"

File System Cache Benefits

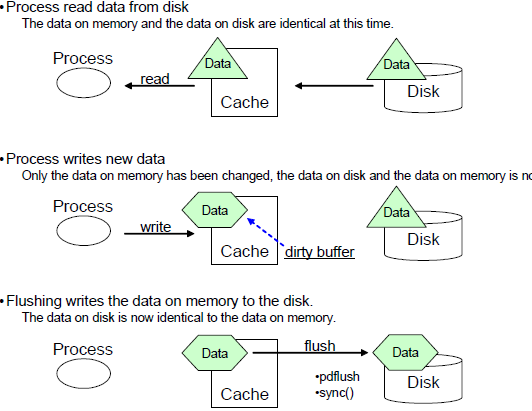
Linux uses free memory that is not being used by application for caching file system pages and disk blocks. Memory used by file system cache is counted as free memory and available when needed (after writing modified pages to backing store or disk). Linux "free" reports file system cache memory as free memory. Benefit of having file system cache is improved performance of application file system reads and writes:
  • Read: When application reads from a file, kernel performs a physical IO to read data blocks from the disk. Data is cached in the file system cache for later use to avoid physical read. When application requests the same block, it only requires a logical IO (reading from filesystem page cache) and that improves application performance. Also, file systems prefetch (read ahead) blocks, when sequential IO pattern is detected, in an anticipation that application will request next adjacent blocks. This also help reduce IO latencies.
  • Write: When application writes to a file, kernel caches data into page cache and acknowledges completions (called buffer writes). Also file data sitting in filesystem cache can be updated multiple times (called write cancelling) in memory before kernel schedules dirty pages to be written to disk. 
    File System cache improves both read and write performance

    Dirty pages in file system cache are written by "flusher" (old name is pdflush) kernel thread. Dirty pages are flushed periodically when the proportion of dirty buffers in memory exceeds a certain threshold (kernel tunable). File system cache improves application IO performance by hiding storage latencies.

HugeTLB or HugePages Benefits

TLB miss results in walk to memory resident page tables

As discussed earlier,TLB (Translation Lookaside buffer), integrated onto a cpu chip, caches virtual to physical translation. When translation is not found in TLB (event is called TLB miss), it results in expensive walk to memory resident page tables to find virtual to physical memory translation. TLB cache hit is becoming more important due to increasing disparity in cpu and memory speed and memory density. Frequent TLB miss may negatively impact application performance. TLB is a scarce resource on cpu chip and Linux kernel tries to make best use of limited TLB cache entries. Each TLB cache entry can be programmed to provide access to contiguous physical memory addresses of various sizes: 4 KB, 2 MB or 1 GB.  Linux HugeTLB feature allows application to use large pages: 2 MB, 1 GB than the default 4 KB size. 

Intel Haswell core has 64 entries for caching 4 KB page translation, 32 entries for 2 MB and 4 entries for 1 GB pages in L1 DTLB. There is also a unified (shared) L2 TLB that can hold translations for 1024 4 KB or 2 MB pages. Once the virtual address has been calculated, processor probes the TLB cache for v->p translation and then fetches the data in 64 bytes chunk from the physical memory location into L1/L2 hardware caches

Pros and Cons of Linux HugeTLB feature:

Pros:

  • HugeTLB may help reduce TLB misses by covering bigger process address space. For Intel Haswell processor:
    • 4 KB page can cover: 64x4 + 1024x4 = 4 MB
    • 2 MB page can cover: 32x2048 +1024x2048 = 2 GB
    • 1 GB page can cover: 4GB
  • TLB miss with HugeTLB is cheaper to service. Virtual to physical memory translation for 4KB pages via page tables require multiple levels of translations (4 levels for standard 48-bit virtual address space). Larger page size require fewer page table entries and levels are shallower. This reduces memory latency due to 2 level instead of 4 level page tables access and physical memory used for page table translation. 
  • Reduces page fault rates. Each page fault can fill 2 MB or 1GB physical memory than 4 KB. Thus makes the application to warm up much faster.
  • Application performance improvement with HugeTLB depends on application access pattern. If application access pattern shows data locality, HugeTLB will help. However, if application reads from random locations or only few bytes from each page (large hash table lookup) and the working set is too big to fit in TLB cache, then 4 KB page size may offer better performance. 
  • 1 GB page may offer best performance when working set fits in 4GB physical memory. Even when the working set is bigger, page table walk with 1GB will be much quicker.
  • Huge Pages are locked in memory and thus are not candidate for page out during memory shortages
  • Large pages also improve the process of memory pre-fetching by eliminating the need to restart pre-fetch operation at 4K boundaries
  • Transparent HugePages benchmarks results showing remarkable improvment
Cons:
  • Huge Pages require upfront reservation. System Admin is required to set kernel tunable to desired number of HugePages: vm.nr_hugepages=<number_of_pages>
    • Linux Transparent Huge Pages (THP) feature does not have upfront cost. THP is still new and has limited uses and known performance bugs. More THP testing is needed!
  • Application should be HugePage aware. For example: java application should be started with "-XX=+UseLargePages" option in order to use large pages for java heap. Otherwise, pages allocated may not be used for any purpose. One can monitor Huge Page usage using "cat /proc/meminfo|grep PageTables" 
  • HugePages require contiguous physical memory of sizes: 2 MB and 1GB. Request for large pages may fail if the system is running for a longer period and most of the memory is demoted to 4 KB chunks. 

Monday, July 4, 2016

Measuring Intel Hyper-Thread Overhead

Multi-core processors are capable of running multiple software streams/tasks concurrently. Multi-core allows a physical processor to simultaneously execute instructions from multiple processes or threads. Core of a processor is the part that executes application instructions. Core is shared by hardware threads (called Hyper-Threads). When two hyper-threads are active in the same core, it results in lower performance of compute intensive tasks as compared to a single thread using core exclusively. Traditional Linux tools (vmstat, mpstat..) do not show core utilization to help estimate the cost of core sharing. One can, however, measure hyper-thread overhead by:  Disabling Hyper-thread, selectively binding tasks to available cores, or comparing CPI (cycles per instruction) or IPC (Instruction per cycle) metrics collected via Linux perf.

Similar to Software multithreading (MT), that refers to execution of multiple tasks within a single process, multi-core processor does the same in the hardware by executing multiple software threads simultaneously across multiple cores and hardware threads (Hyper-threads or HT) within a single physical processor (socket). Multi-core processors are ideal for throughput computing. Concurrency in the software is required in order to gain significant throughput by utilizing all available hardware threads and cores in physical cpu. Hardware threads in each core are seen by Linux scheduler as a separate cpu where the task can be scheduled. Caches in physical processor are also shared by hardware threads.

Linux scheduler uses hierarchical relationship when scheduling a process/task to a cpu.
         Hyper-Threads → Core → Physical CPU (Socket)
When there is an available core in the physical cpu, new task is assigned to this core. Once all cores are occupied, then core is shared (two HT/core). 
    " Intel® HT technology is a great performance feature that can boost performance by up to 30%.."
HT does not double the core throughput, only improves it by 30%. Thus two compute intensive tasks sharing the core will run at 60-70% performance (30-40% slower). 

Why Multi-Core

Processor Industry before multi-core was primarily focused on increasing cpu clock and deep pipelining to improve serial performance, requireing more logic and silicon space, that resulted in higher power requirements and heat dissipation. Multi-core architecture took a different approach. It traded serial performance for a higher throughput. Instead of implementing complicated logics and pipelining, it duplicated compute logic by implementing multiple dedicated processing units instead of just one. End result is a simple processor design with low power, less heat dissipation but massive throughput capabilities. Multi-core processors are thus ideal when software is designed to run multiple tasks in parallel to take full advantage of large number of compute engines available.

Another reason for multi-core popularity is that it uses physical cpu resources more efficiently. As the gap between processor and memory speeds widens, performance gain by ramping up the processor clock begins to have diminishing returns with processor stalling waiting for memory. Studies have shown that processors in most servers in real world deployments spent 80% of their time stalled waiting for memory or IO and thus high clock rates and deep pipelines of traditional processors are wasted stalling on cache refills from main memory. Hardware threads in Multi-core processor reduce the overhead of these frequent cache stalls and achieve maximum memory bandwidth by automatically parking stalled hardware threads and switching to next ready to run hardware threads leading to efficient processor utilization. Multi-core processor can access instructions from both threads within the same time slice, and that reduces cpu stalls and improves efficiency and throughput.

 Xen Virtual CPU(vcpu) Binding

In server virtualization, hypervisor divides cpu resources across multiple virtual machines or guests. Hypervisor assigns each guest a fixed set of virtual cpus (vcpu). Hypervisor scheduler is responsible for scheduling guest's vcpus onto hyper-threads, whereas Linux scheduler (running inside the guest) schedules processes or threads to assigned vcpus.

Amazon cloud instances (i2, r3, m4, d2 ,c3, c4, x1..) are based on Intel Xeon Ivy Bridge, Haswell processors with 2-3 GHz + Turbo speed and large caches. Each Physical CPU can have 8-16 cores, where each core is shared by two hyper-threads with private L1, L2 caches. There is also a large unified L3 cache shared by all cores in the physical processor
Amazon uses modified version of Xen Hypervisor. It assigns a dedicated core (2 HT) to a 2-cpu instance, 4-cpu instance gets 2 dedicated cores (4 HT) and so on.. 
Hierarchical relationship seen by Linux running on the instance may not be the same as it is on the physical system. One can use "/proc" stats, exported by kernel, to find relationship between: vcpu, hyperthreads and cores.
Type/proc/cpuinfoDetail
Socketphysical idphysical cpu or socket on a motherboard. Example: Amazon d2.8xl instance has two sockets: physical id: 0, 1
CorescoresNumber of cores in physical cpu or socket. Example: d2.8xl has 18 cores, 9 cores in each socket: cpu cores: 9
Core IDcores idEach core is assign an id. Example: d2.8xl has core ids: 0,1,2,3,4,5,6,7,8
HyperThreadprocessorEach core is shared by 2 HT. Example: d2.8xl has 36 HT: 0,1,2,3,...35
Note: $egrep "(( id|processo).*:|^ *$)" /proc/cpuinfo
In case of Amazon d2.8xl instance that has 18 cores across two sockets, there is a 1:1 mapping between vcpu and HT. Instance vcpu 0-17 are first assigned to HT in cores 0-8 in Socket 0 and Socket 1. Next, Xen hypervisor repeats the vcpu assignments and doubles each core occupancy.
d2.8xl
Phase I
Socket 09 corescore-id: 0-8vcpus (coreid, vpc#): (0,0)(1,1)(2,2)(3,3)(4,4)(5,5),(6,6)(7,7),(8,8)
Socket 19 corescore-id: 0-8vcpus (coreid, vpc#):  (0,9)(1,10)(2,11)(3,12)(4,13)(5,14)(6,15)(7,16)(8,17)
Double the occupancy
Socket 09 corescore-id: 0-8vcpus (coreid, vpc#):  (0,18)(1,19)(2,20)(3,21)(4,22)(5,23)(6,24)(7,25)(8,26)
Socket 19 corescore-id: 0-8vcpus (coreid, vpc#):  (0,27)(1,28)(2,29)(3,30)(4,31)(5,32)(6,33)(7,34)(8,35)

One can disable HT in BIOS, but you don't have access to BIOS on cloud instance. There are other ways to disable HT:
  • Pass boot arguments maxcpus=<#ofcores> by updating /boot/grub/menu.lst file. Save and reboot the server. Setting maxcpus=18 reduces number of vcpu that needs to be assigned to available cores and thus will cause socket 0 and 1 to be populated only once.
  • You can find what cores sibling (HT) are sharing using /proc data and then use this information to disable sibling hyper-thread

#!/bin/bash
for num in `cat /proc/cpuinfo|grep processor|awk '{print $3}'`
do
echo sibling of cpu$num
cat /sys/devices/system/cpu/cpu$num/topology/thread_siblings_list
done
======save it into test.sh file and execute=====
~$ ./test.sh
sibling of cpu0
0,18
sibling of cpu1
1,19
sibling of cpu2
2,20
sibling of cpu3
3,21
sibling of cpu4
4,22
...
Disable HT on a live system
#!/bin/sh
if [ "$(id -u)" != "0" ]; then
  echo "This script must be run as root. You should type:sudo -s" and then run the script 1>&2
  exit 1
fi
cat /sys/devices/system/cpu/cpu*/topology/thread_siblings_list |
sort -u |
while read sibs
do
   case "$sibs" in
           *,*)
                   oldIFS="$IFS"
                   IFS=",$IFS"
                   set $sibs
                   IFS="$oldIFS"
                   shift
                   while [ "$1" ]
                   do
                           echo Disabling CPU $1 ..
                           echo 0 > /sys/devices/system/cpu/cpu$1/online
                           shift
                   done
                   ;;
           *)
                   ;;
   esac
done

As you can see in the output below only one thread is occupying the core.
$ lscpu
Architecture:          x86_64
CPU op-mode(s):        32-bit, 64-bit
Byte Order:            Little Endian
CPU(s):                36
On-line CPU(s) list:   0-17
Off-line CPU(s) list:  18-35 << Disabled vCPU
Thread(s) per core:    1 <<

Core(s) per socket:    9
Socket(s):             2
..

Enable or online all vcpu. You cannot offline cpu 0
#!/bin/bash
NCPUS=`lscpu|grep ^CPU\(s\)|awk '{print $2}'`
NUM=1
for (( cpuid=$NUM; cpuid<$NCPUS; cpuid++ ))
do
echo enabling cpu$cpuid
echo 1 > /sys/devices/system/cpu/cpu$cpuid/online
cat /sys/devices/system/cpu/cpu$cpuid/online
done
lscpu
======
Verify it:
lscpu
Architecture:          x86_64
CPU op-mode(s):        32-bit, 64-bit
Byte Order:            Little Endian
CPU(s):                36
On-line CPU(s) list:   0-35   << All cpus are online
Thread(s) per core:    2 <<

Core(s) per socket:    9
Socket(s):             2
...

To test HT overhead, one can use "taskset" utility to set task affinity.  Once you know what vcpus and HT are sharing a core, use taskset to set task affinity. One can also use Linux containers or Docker to constrain the workload to subset of cpus. This way you don't need to disable HT and can bind the process(es) to a particular vcpu or group of vcpu.

~$ sudo taskset -pc 0,1,2 $$
pid 37091's current affinity list: 0-35
pid 37091's new affinity list: 0-2
This will result current shell to bind to vcpu 0,1,2. Thus running any task or application from this shell will limit the processes to subset of total cpus. Start the cpu load:
$ yes > /dev/null &; yes > /dev/null & ; yes > /dev/null &
$ mpstat -P ALL 1
This shows only 0,1,2 cpus are 100% cpu bound.
11:45:44 PM  CPU    %usr   %nice    %sys %iowait    %irq   %soft  %steal  %guest  %gnice   %idle
...
11:45:45 PM    0  100.00    0.00    0.00    0.00    0.00    0.00    0.00    0.00    0.00    0.00
11:45:45 PM    1   99.01    0.00    0.99    0.00    0.00    0.00    0.00    0.00    0.00    0.00
11:45:45 PM    2   99.00    0.00    1.00    0.00    0.00    0.00    0.00    0.00    0.00    0.00
11:45:45 PM    3    0.00    0.00    0.00    0.00    0.00    0.00    0.00    0.00    0.00  100.00
11:45:45 PM    4    0.00    0.00    0.00    0.00    0.00    0.00    0.00    0.00    0.00  100.00
11:45:45 PM    5    0.00    0.00    0.00    0.00    0.00    0.00    0.00    0.00    0.00  100.00

When to disable Hyper-Threading

Multi-Core processors are designed for throughput computing. Throughput computing is about performing multiple tasks in parallel by spreading the work across many compute engines (HT and cores). Each task may take little longer due to slower clock rate and shared cpu resources used by HT, but many task will be completed in a unit time and that improves application throughput. In general, when HT is enabled, number of cpu resources are statically allocated and shared to run extra thread in the cpu core. How much HT hurts application performance depends on design:
  • Compute intensive application with small working set that fits into cpu caches are the one impacted the most with HT enabled.
  • Lack of concurrency in application resulting higher contention for shared resources. More processors means more contention. Higher contention will cause less execution and thus processors will be either sitting idle or doing no productive work due to waiting for lock (context switch) or spinning on lock (busy-waiting).
One should also take into account additional factors such as:
  • Proper application sizing (threads) to take into account additional vcpus.
  • Too much locking may have higher overhead with more cpus.
  • Application with large number of threads, but has a hot code (frequently run functions) that utilizes only few threads, then having additional vcpu may not do much.
  • Heavy memory intensive application that is capable of utilizing full memory controller bandwidth may not see performance gain when HT is enabled.
  • False sharing can happen when two processors share the same cache-line, commonly occurs for global and static variables. This results in inefficient use of cpu caches and may cause application to run at memory speed due to frequent load/store operations. 
  • NUMA latencies. Verify if the system is numa (Non-Uniform Memory Access). Large Amazon Instances: xx.8xl and above are NUMA. If not planned correctly, application running on NUMA may experience higher memory latencies. Application should use numa library or "numa" utility to hint kernel how its memory allocation should be handled. 
How to test Hyper-Threading Overhead
Comparing data captured with or without HT during tests will help quantify performance gain or loss. Lower cpu utilization is a sign of scaling problem due to insufficient software threads, serialized code and lack of concurrency. To estimate HT overhead, one should measure:
  • Core Utilization: CPU utilization may not the best way to measure and compare HT overhead. Utilization measures how much cpu headroom is available. One may assume cpu utilization would cut into half considering HT doubles the number of vcpus. It does not, however, translate into 2 x speed up if all vcpu are utilized. Instead of cpu utilization, one should look at other metrics such as: work done per unit time (RPS) and elapsed time (latency) to assess performance changes due to HT. Linux tools like top, mpstat and others do not offer clear insight into core utilization. All you get is the vcpu utilization. One can wrap /proc data in script to capture core utilization

#!/bin/bash
SOCKETS=`grep "physical id" /proc/cpuinfo|sort -ru|head -1|awk '{print $4}' `
sockets="SOCKETS"    #converts into integer
NCORES=`grep cores /proc/cpuinfo|sort -u|awk '{print $4}'`
ncores="NCORES"
NUM=0
if [ $sockets != 0 ]; then
  NCORES=$((($sockets + 1) * $ncores))
fi
for (( core=$NUM; core<$NCORES; core++ ))
do
SIBLING=`cat /sys/devices/system/cpu/cpu$core/topology/thread_siblings_list`
echo Core $core Utilization: Threads:$SIBLING
mpstat -P $SIBLING 1 2
done
-------save it ---
Core 0 Utilization: Threads:0,18
Linux 3.13.0-49-generic (abyssagents-Same-AZ-Test-i-f603ce47) 12/16/2015 _x86_64_ (36 CPU)
10:44:33 PM  CPU    %usr   %nice    %sys %iowait    %irq   %soft  %steal  %guest  %gnice   %idle
10:44:34 PM    0    0.00    0.00    0.00    0.00    0.00    0.00    0.00    0.00    0.00  100.00
10:44:34 PM   18    0.00    0.00    0.00    0.00    0.00    0.00    0.00    0.00    0.00  100.00
..Core 1 Utilization: Threads:1,19
Linux 3.13.0-49-generic (abyssagents-Same-AZ-Test-i-f603ce47) 12/16/2015 _x86_64_ (36 CPU)
10:44:35 PM  CPU    %usr   %nice    %sys %iowait    %irq   %soft  %steal  %guest  %gnice   %idle
10:44:36 PM    1    0.00    0.00    0.00    0.00    0.00    0.00    0.00    0.00    0.00  100.00
10:44:36 PM   19    0.00    0.00    0.00    0.00    0.00    0.00    0.00    0.00    0.00  100.00
,..
  • HT double the number of vcpu that Linux can schedule a task or thread. That means twice as many threads will be running simultaneously. Let's assume a system with four cores with HT disabled, running four compute threads in parallel. If the 1 unit of work is computed by each thread in a second, then four threads will compute 4 unit of works in a seconds (4 units/s). With HT enabled, we can now run 8 threads (sharing core) in parallel. Expected gain should be: 4 x 1.25 = 5 units/s instead of 8 units/s. Due to shared core, compute latency is increased = 8 units / 5 units/s = 1.6 seconds. Thus HT improved overall throughput by 25% but at a cost of higher latency. Although it seems like response time may increase with HT, it is normally not the case due to less context switching with more available cpus.
  • Core and Thread CPI: CPI stands for Cycles per Instruction. It is an average time it takes to execute a given set of instructions. CPI is an indicative of instruction level parallelism in the code. CPI can also be used to estimate memory fetch latency when a cache line is invalidated due to stale data found in cpu caches. For example: Intel processors based on Nehalem core can execute 4 instructions per clock, that is equivalent to a CPI 0.25. Due to cache misses and branch mispredictions, real-world applications has an average CPI of 1.0 or 2.0.
    To capture Core CPI, disable HT and measure CPI. Since the core is dedicated to single thread, it will give you Core CPI. Now enable HT. Since two threads shared the core, they may execute different number of instructions and CPI. Let's assume over a sampling period, two threads sharing a core utilized 1 Million core cycles. During that period Thread-1 executed 750k and Thread-2 500k instructions. In this case, Thread-1 CPI:1.33, Thread-2 CPI: 2.0 and Core CPI :0.80 (1 Million cycles/ 750+500 instructions).

Note: CPI data is available through Intel PMU (Performance Monitoring Unit) and can be extracted using Linux perf tool and Intel pcm utility. Unfortunately, access to PMU registers is restricted on Amazon instances. We are working with Amazon to provide these capabilities. 

sysbench cpu benchmark tool can be used to compare cpu core compute throughput and HT overhead.  
One can use taskset to limit cpus where sysbench threads can be scheduled. Use core sibling information to run sysbench in dedicated or shared cores. Use perf to capture IPC/CPI metrics. Higher IPC is better as it means less number of stalled cycles

Example:
Running sysbench threads in dedicated cores. System has 4 cores (8 HT or vcpu)
$ sudo taskset -pc 0,1,2,3

Run 4 sysbench threads:
sysbench --max-requests=10000000 --num-threads=4 --test=cpu --cpu-max-prime=10000 run

While test is running, capture CPI/IPC metrics
$ sudo perf stat -a  -p  <sysbench_pid>

# perf stat -a -p 6841
Performance counter stats for process id '6841':

    487861.349722 task-clock (msec)         #    4.002 CPUs utilized           [100.00%]
           42,184 context-switches          #    0.086 K/sec                   [100.00%]
                2 cpu-migrations            #    0.000 K/sec                   [100.00%]
                0 page-faults               #    0.000 K/sec                  
1,424,306,903,878 cycles                    #    2.919 GHz                     [83.34%]
  706,061,423,450 stalled-cycles-frontend   #   49.57% frontend cycles idle    [83.33%]
  196,403,173,757 stalled-cycles-backend    #   13.79% backend  cycles idle    [66.67%]
  550,084,970,527 instructions              #    0.39  insns per cycle  <<      
                                            #    1.28  stalled cycles per insn [83.34%] <<
..

Running sysbench threads in shared core
$sudo taskset -pc 0,1,4,5 $$
pid 6801's current affinity list: 0-3
pid 6801's new affinity list: 0,1,4,5

$mpstat -P ALL 1
01:56:17 PM  CPU    %usr   %nice    %sys %iowait    %irq   %soft  %steal  %guest  %gnice   %idle
01:56:18 PM  all   50.00    0.00    0.00    0.00    0.00    0.00    0.00    0.00    0.00   50.00
01:56:18 PM    0  100.00    0.00    0.00    0.00    0.00    0.00    0.00    0.00    0.00    0.00
01:56:18 PM    1  100.00    0.00    0.00    0.00    0.00    0.00    0.00    0.00    0.00    0.00
01:56:18 PM    2    0.00    0.00    0.00    0.00    0.00    0.00    0.00    0.00    0.00  100.00
01:56:18 PM    3    0.00    0.00    0.00    0.00    0.00    0.00    0.00    0.00    0.00  100.00
01:56:18 PM    4  100.00    0.00    0.00    0.00    0.00    0.00    0.00    0.00    0.00    0.00
01:56:18 PM    5  100.00    0.00    0.00    0.00    0.00    0.00    0.00    0.00    0.00    0.00
01:56:18 PM    6    0.00    0.00    0.00    0.00    0.00    0.00    0.00    0.00    0.00  100.00
01:56:18 PM    7    0.00    0.00    0.00    0.00    0.00    0.00    0.00    0.00    0.00  100.00

Performance counter stats for process id '6864':

    497028.064408 task-clock (msec)         #    4.000 CPUs utilized           [100.00%]
           42,884 context-switches          #    0.086 K/sec                   [100.00%]
                3 cpu-migrations            #    0.000 K/sec                   [100.00%]
                0 page-faults               #    0.000 K/sec                  
1,449,788,400,730 cycles                    #    2.917 GHz                     [83.33%]
1,010,235,123,660 stalled-cycles-frontend   #   69.68% frontend cycles idle    [83.33%]
  592,764,654,453 stalled-cycles-backend    #   40.89% backend  cycles idle    [66.67%]
  361,851,972,955 instructions              #    0.25  insns per cycle        <<
                                            #    2.79  stalled cycles per insn [83.33%] <<
..
Simple test below can also be used to estimate work done in a unit time.
start compute bound job:
for i in {1..2}; do dd if=/dev/zero bs=1M count=2070 2> >(grep bytes >&2 ) | gzip -c > /dev/null & done
Change 1..2 to 1..4 to start four process or use /proc data (as shown earlier) to start the compute bound job on selected cores and vcpus.
References